

Olympia Financial Group Inc.
AI Resilience & Client Asset Growth Beat
Published: May 22, 2026
Author: FRC Analysts
Disclosure: Olympia Financial Group Inc. has paid FRC a fee for research coverage and distribution of reports. See last page for other important disclosures, rating, and risk definitions.
Company Details
Sector – Financial Services
Industry – Asset Management
Trading Information
Trading information – OLY.TO : TSX
Report Highlights
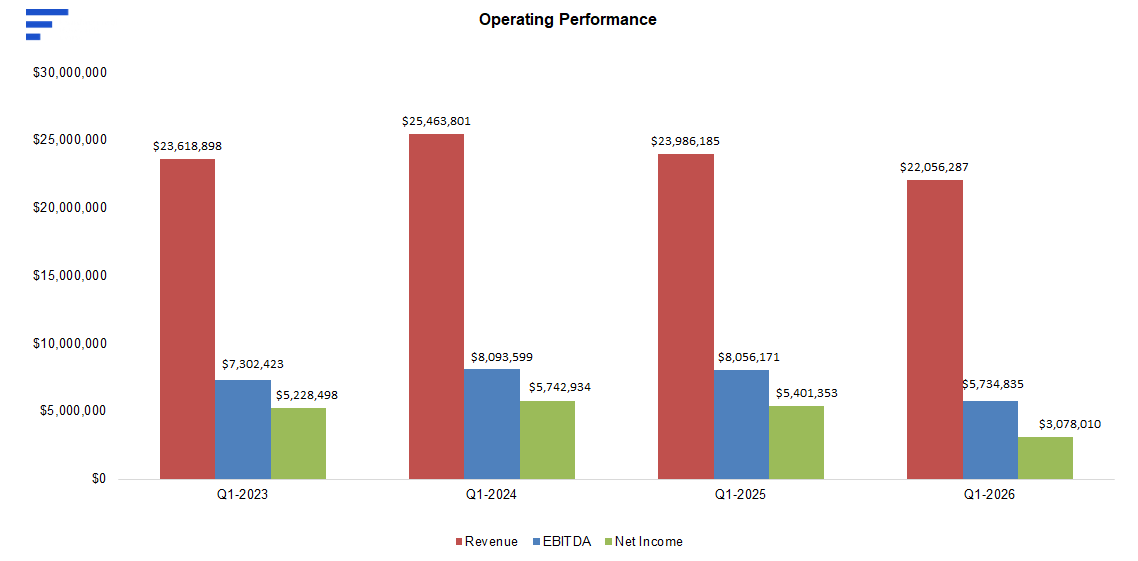
- Q1-2026 Results: Revenue -8% YoY, and -8% vs our estimate, driven by lower interest on unallocated client capital. Adj. EPS -43% YoY, on weaker interest revenue, and higher G&A expenses, and -11% vs our estimate. Dividends steady at $7.20/share (6.13% yield), in line.
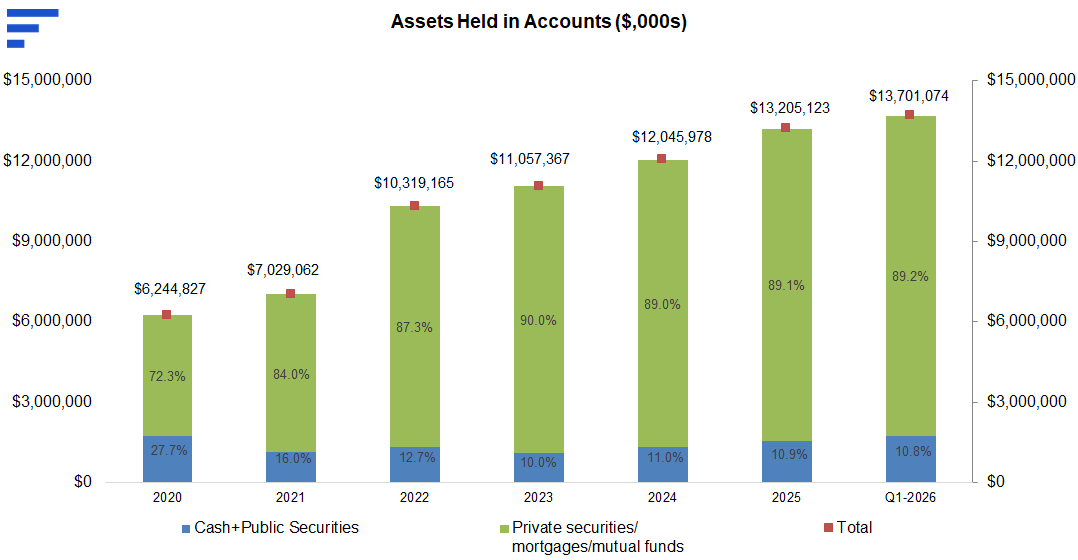
- Client Assets: Client assets +4% QoQ to $13.7B (+0.8% vs est.). Core services revenue +8% YoY on higher transaction volumes, implying robust fundamentals. We expect continued services revenue growth, driven by strong demand for alternative investments, particularly Mortgage Investment Corporations (MICs), which form a meaningful share of client assets, and offer attractive yields in a low-rate environment.
- Interest Revenue Outlook: ~45% of revenue comes from interest on unallocated client capital held in cash accounts at major Canadian banks/credit unions. We expect stable rates through 2026 (unemployment easing since September 25 peak; inflation moderate), supporting interest revenue after recent declines.
- Growth Catalyst: Licensed in all provinces except Ontario; potential federal approval to expand into Ontario is a key catalyst.
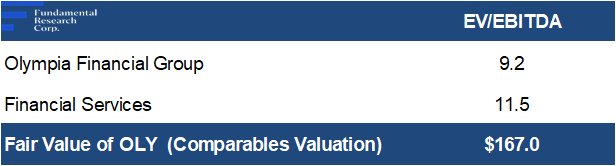
- Valuation & AI Resilience: Trades at 9.2x EV/EBITDA vs sector average of 11.5x (20% discount). Wealth managers like Charles Schwab (NYSE: SCHW) and Raymond James (NYSE: RJF) are down ~10% YTD on AI disruption fears, while OLY is up 5% YTD. OLY remains largely insulated from AI disruption due to its regulated custodial/admin services for registered accounts (legal requirement, not AI-replaceable). The company also benefits from a strong Canadian niche with limited competition, particularly in alternative investments.
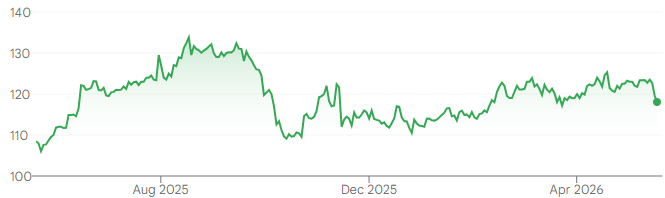
Price and Volume (1-year)
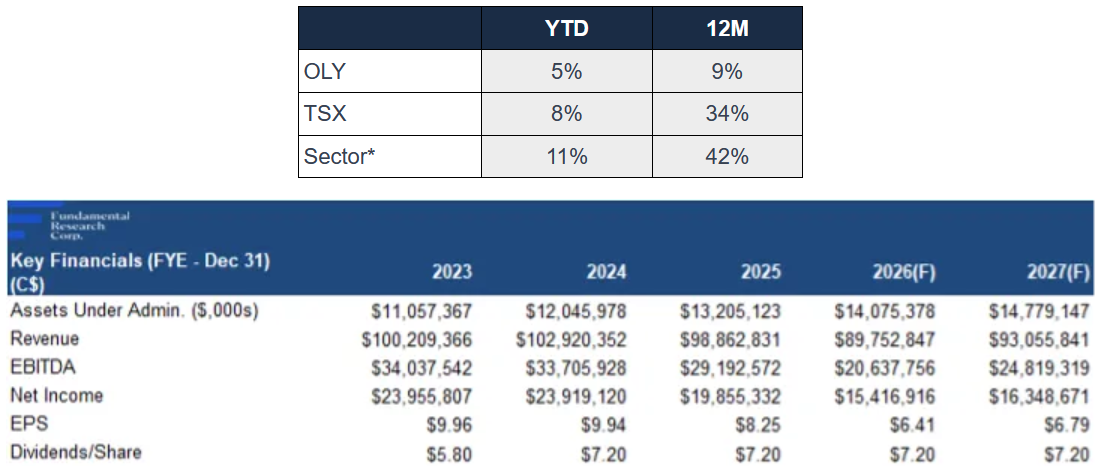
* Olympia Financial Group has paid FRC a fee for research coverage and distribution of reports. See last page for other important disclosures, rating, and risk definitions. All figures in C$ unless otherwise specified.
The leading Canadian custodian/ administrator of alternative investments
Primary Services
- Investment Account Services (IAS): Trustee/custodian/administrator for self-directed registered investment accounts focused on alternative investments
- Private Health Services: Administration of health spending accounts for small/mid-sized corporations
- Corporate and Shareholder Services: Corporate trust and transfer agency (register maintenance, AGM support, dividend reinvestment)
- Raisr (Exempt Edge): IT services for exempt market dealers, issuers, and investment advisors
OLY’s platform supports a broad range of investments typically not offered by banks or traditional trading platforms
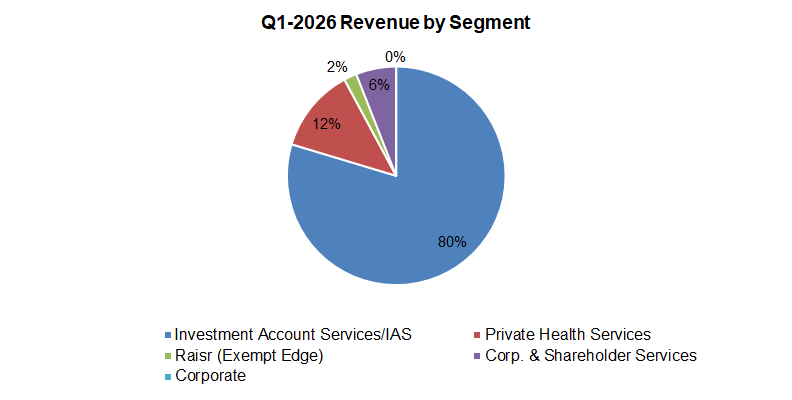
In Q1-2026, the revenue mix remained stable: 80% from IAS (81% in Q1-2025), 12% from private health services (11%), and 8% (7%) from other services
Source: Company / FRC
Client assets +4% QoQ to $13.7B, and +0.8% vs our forecast
Raising our 2026 year-end estimate, from $13.96B to $14.08B
In March 2026, OLY sold its currency division for $3.06M. The division provided FOREX and cross-border payment services for corporates and individuals, generating $5.18M in 2025 revenue, ~5% of group revenue. We view this as a pragmatic divestiture: (a) the division was unprofitable, with losses of $1M in 2025 , and $0.31M in Q1 – 2026; and (B) it was small, non-core, and outside OLY’s
Divests its currency division
main expertise. We believe the sale should allow OLY to focus on its higher-priority businesses.
Financials (Year-End: Dec 31st)
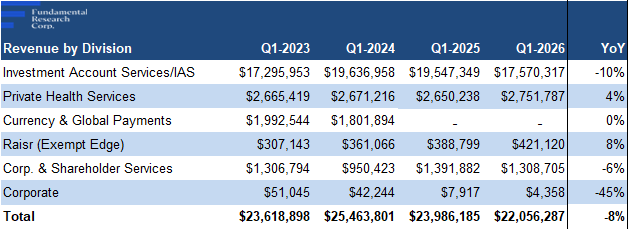
Q1 revenue -8% YoY, and -8% vs our estimate, driven by lower interest on unallocated client capital, with average rates 0.2 pp below our forecast
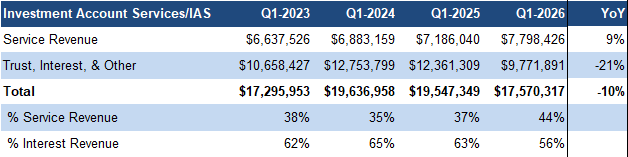
Notably, services revenue from core divisions (IAS and Private Health Services) was up 8% YoY, driven by higher transaction volumes
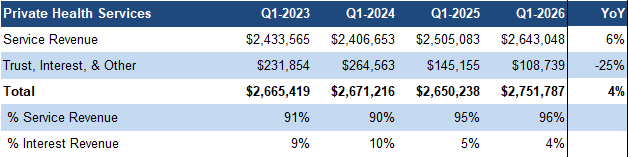
*The primary source of revenue in the “Trust, Interest, & Other” category is the interest earned on placing undeployed client capital in cash accounts at major Canadian banks.
*Service revenue includes annual and transaction fees
*‘Trust, interest, and other’ primarily includes interest revenue
Source: FRC / Company
G&A expenses rose 5% YoY, in line with our estimate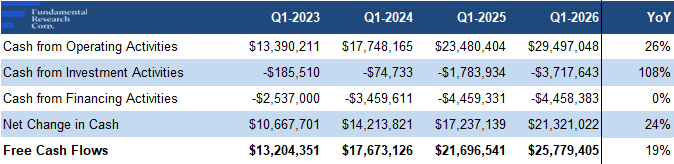
EPS (excluding gain on sale of the currency division) was down 43% YoY, primarily due to weaker interest revenue, and higher G&A expenses, missing our estimate by 11%
ource: Company/FRC
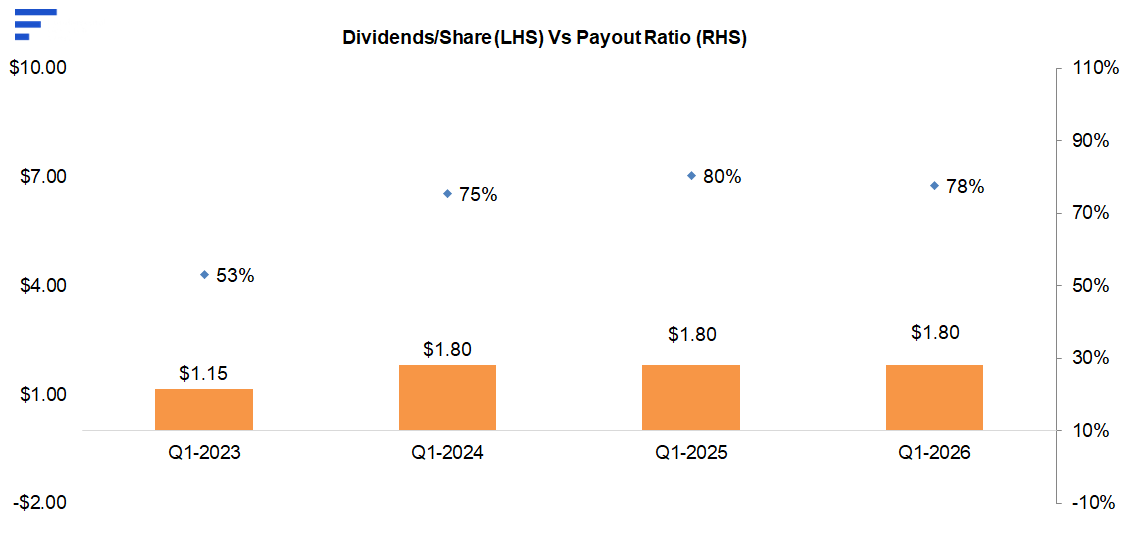
Annual dividends held steady at $7.20/year, aligning with our estimate
Source: Company/FRC
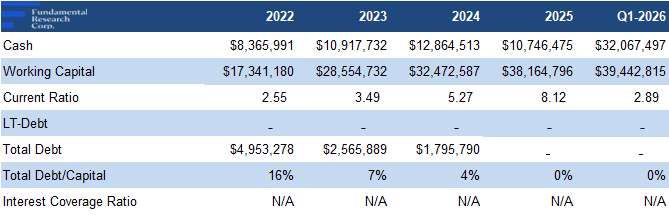
Strong, debt-free balance sheet, indicating very low risk of dividend cut or shortfall
FRC Projections and Valuation
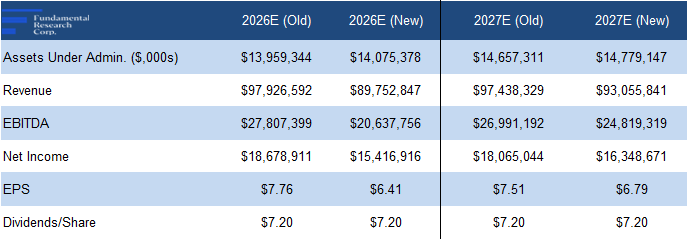
Given the lower-than-expected interest revenue, we are lowering our revenue and EPS forecasts
The divested division also weighed on revenue, but not EPS, as we had projected a minor loss from that division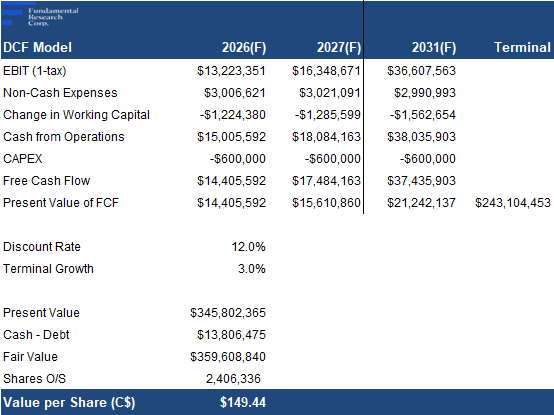
Source: FRC
As a result of lower interest revenue, our DCF valuation declined from $154 to $149/share
To view the complete report, click on the button above.
The opinions expressed in this report are the true opinions of the analyst(s) about any companies and industries mentioned. Any “forward looking statements” are our best estimates and opinions based upon information that is publicly available and that we believe to be correct, but we have not independently verified with respect to truth or correctness. There is no guarantee that our forecasts will materialize. Actual results will likely vary. The companies listed above are covered by FRC under an issuer-paid model, where fees have been paid to FRC to commission this report and research coverage. This creates a potential conflict of interest which readers should consider. Distribution procedure: our reports are distributed first to our web-based subscribers on the date shown on this report then made available to delayed access users through various other channels for a limited time. To subscribe for real-time access to research, visit https://www.researchfrc.com/plans for subscription options. This report contains “forward looking” statements. Forward-looking statements regarding the Company, industry, and/or stock’s performance inherently involve risks and uncertainties that could cause actual results to differ from such forward-looking statements. Factors that would cause or contribute to such differences include, but are not limited to, continued acceptance of the Company’s products/services in the marketplace; acceptance in the marketplace of the Company’s new product lines/services; competitive factors; new product/service introductions by others; technological changes; dependence on suppliers; systematic market risks and other risks discussed in the Company’s periodic report filings, including interim reports, annual reports, and annual information forms filed with the various securities regulators. By making these forward-looking statements, Fundamental Research Corp. and the analyst/author of this report undertakes no obligation to update these statements for revisions or changes after the date of this report. Fundamental Research Corp DOES NOT MAKE ANY WARRANTIES, EXPRESSED OR IMPLIED, AS TO RESULTS TO BE OBTAINED FROM USING THIS INFORMATION AND MAKES NO EXPRESS OR IMPLIED WARRANTIES OR FITNESS FOR A PARTICULAR USE. ANYONE USING THIS REPORT ASSUMES FULL RESPONSIBILITY FOR WHATEVER RESULTS THEY OBTAIN FROM WHATEVER USE THE INFORMATION WAS PUT TO. ALWAYS TALK TO YOUR FINANCIAL ADVISOR BEFORE YOU INVEST. WHETHER A STOCK SHOULD BE INCLUDED IN A PORTFOLIO DEPENDS ON ONE’S RISK TOLERANCE, OBJECTIVES, SITUATION, RETURN ON OTHER ASSETS, ETC. ONLY YOUR INVESTMENT ADVISOR WHO KNOWS YOUR UNIQUE CIRCUMSTANCES CAN MAKE A PROPER RECOMMENDATION AS TO THE MERIT OF ANY PARTICULAR SECURITY FOR INCLUSION IN YOUR PORTFOLIO. This REPORT is solely for informative purposes and is not a solicitation or an offer to buy or sell any security. It is not intended as being a complete description of the company, industry, securities or developments referred to in the material. Any forecasts contained in this report were independently prepared unless otherwise stated, and HAVE NOT BEEN endorsed by the Management of the company which is the subject of this report. Additional information is available upon request. THIS REPORT IS COPYRIGHT. YOU MAY NOT REDISTRIBUTE THIS REPORT WITHOUT OUR PERMISSION. Please give proper credit, including citing Fundamental Research Corp and/or the analyst, when quoting information from this report. The information contained in this report is intended to be viewed only in jurisdictions where it may be legally viewed and is not intended for use by any person or entity in any jurisdiction where such use would be contrary to local regulations or which would require any registration requirement within such jurisdiction.
