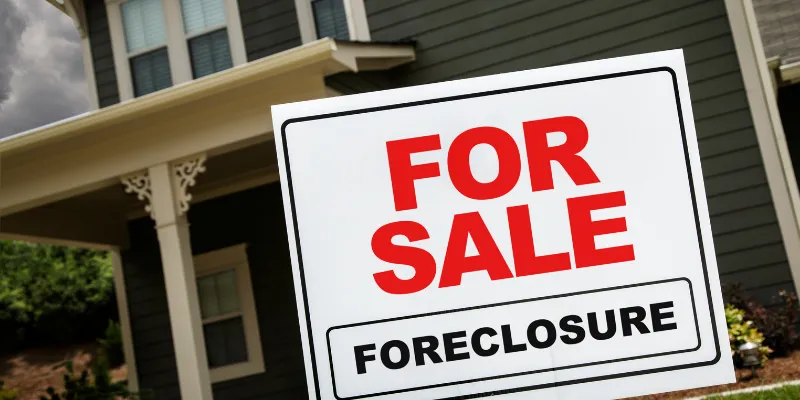
Foreclosure activity is climbing again in the U.S., not as a repeat of the 2008 crisis, but as a clear sign that the housing market is shifting into a new phase that business leaders need to understand. In 2025, there were foreclosure filings on 367,460 U.S. properties, a 14% increase from 2024, yet still roughly 25% below 2019 levels before the pandemic era distortions set in.
Those two facts sit together in tension and that tension is where the story really is. On one hand, filings are rising for the ninth or tenth consecutive month in many datasets, which tells you the period of artificially low distress, helped by stimulus, forbearance, and very low interest rates, is over. On the other hand, the national foreclosure rate in 2025 was about 0.26% of residential properties, far below the 2.23% peak seen in 2010, and analysts emphasize that most owners still sit on substantial equity cushions.
Florida is where this gradual national shift becomes concrete. The state recorded the highest foreclosure rate in the country in 2025, with filings on about 0.44% of residential properties, roughly one in every 230 housing units. That may not sound dramatic on its own, but it is meaningfully above the national average and it places Florida ahead of every other state in terms of how frequently properties enter some stage of foreclosure.
This is where the distinction between counts and rates matters. Large states like Florida, Texas, or California will almost always generate large absolute numbers simply because they have more homes, more loans, and more economic activity. A higher rate, such as Florida’s 0.44% compared with a national 0.26%, signals that something specific is happening in that local ecosystem, whether that is related to affordability, insurance costs, local tax burdens, investor activity, or employment patterns.
Analysts who follow the state point to a combination of rising ownership costs and evolving demand as important context for Florida’s ranking. Insurance premiums and property taxes have climbed in many counties, and when they layer on top of higher mortgage rates, they push monthly costs to levels that some pandemic era buyers did not fully anticipate. At the same time, growing inventory in a few Florida markets has cooled price growth and lengthened selling times, which weakens the easy exit that equity rich owners enjoyed during the boom.
Florida is not alone at the top of the foreclosure table. Delaware, South Carolina, and Illinois follow closely, with foreclosure rates only slightly lower than Florida’s, roughly one in every 240 to 248 housing units. That cluster is a reminder that this is not just a Sunbelt story, and that regional differences in legal processes, job markets, and ownership profiles all show up in distress data once you look past national averages.
The monthly numbers reinforce the sense of a market that is normalizing rather than collapsing. In December 2025, there were about 44,990 U.S. properties with a foreclosure filing, up 26% from the prior month and 57% from a year earlier, a sharp move in rate of change terms that still leaves activity far below the last crisis era. Industry commentary describes this pattern as a recalibration as courts work through backlogs, lenders move more loans through the system, and owners who stretched during the low rate period confront higher carrying costs.
The practical takeaway is not that another 2008 style meltdown is underway, but that foreclosure data has re entered the set of indicators that deserve regular attention. Rising filings in Florida and in states like Delaware, South Carolina, and Illinois can affect everything from local consumer spending to bank loss reserves, insurance pricing, and construction pipelines. Understanding where rates are rising fastest, rather than just where counts are largest, helps companies calibrate risk and plan ahead in a housing market that is no longer artificially quiet, but not yet in crisis either.