
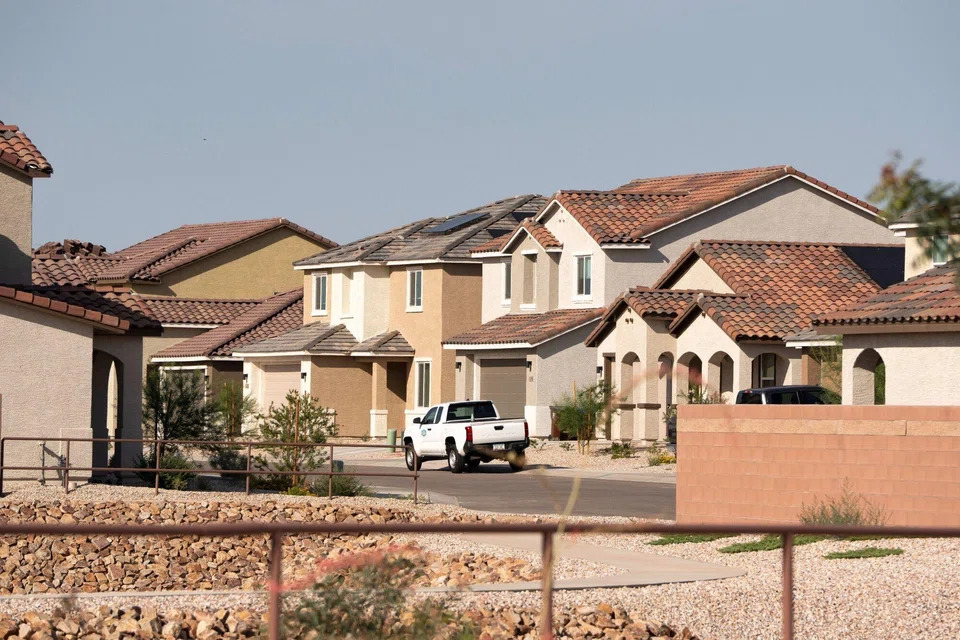
The balance of power in the U.S. housing market has tipped further toward buyers than at any point in more than a decade. A new report from Redfin estimates there were 62.6% more home sellers than buyers in September, the widest gap in data going back to 2013. It was the fourth record in a row, and the margin jumped from 56.9% in August.
The numbers behind that gap tell a simple story. Buyers are stepping back while sellers keep arriving. Redfin counted roughly 928,900 active buyers nationwide, the lowest figure in its records and the fifth straight monthly decline. Sellers rose to about 1.51 million, the most since March 2020. Of the 50 large metro areas Redfin tracks, 41 now qualify as buyer’s markets, with Miami, Nashville and Houston showing the biggest imbalances. Asad Khan, a senior economist at Redfin, described this as a buyer’s market driven by caution rather than strength, because so many would-be purchasers have been priced out or unsettled by economic uncertainty.
The softness is not limited to starter homes. Realtor.com released its own data today showing that the price needed to enter the top 10% of listings fell to $1,199,321 in September. That is 3.6% lower than a year ago and marks the 30th straight month of annual declines. The threshold for the top 1% of listings dropped even further, by 5.3%. One detail cuts the other way, though. Luxury homes are actually selling faster than they were a year ago, which suggests wealthy buyers are still active but less willing to pay last year’s prices.
Borrowing costs sit at the center of all this. The yield on the 10-year Treasury note, which lenders use as a reference point when they price mortgages, climbed to roughly 5.29% today after September inflation came in hotter than expected, with consumer prices up 3.7% from a year earlier. Longer-term yields touched their highest levels in 24 years last week. Mortgage rates have followed, with the average 30-year fixed rate reaching 7.28% as of October 1st, compared with 6.34% a year earlier. At those levels, a slightly cheaper house does little to offset a much larger monthly payment.
That math is where rental housing enters the conversation. When buying feels out of reach, many households simply keep renting, and that can support demand for apartments. There are early signs of tightening. Apartment List reported that the national multifamily vacancy rate slipped to 7% in September, down from a peak of 7.3% in February. Apartments.com found average asking rents were 1.5% higher than a year earlier, a faster pace than the year before.
The picture is not one-sided, however. Apartment List’s own rent index was still 0.4% below last year, and its vacancy rate remains high by historical standards. Units are also taking longer to fill, averaging 34 days to lease in September, the slowest reading for that month since tracking began in 2019. For property owners, the same high rates that keep renters in place also raise the cost of refinancing debt or buying new buildings. Higher yields tend to weigh on property values too, since investors expect a bigger return before they commit capital. In parts of the Sun Belt, a large wave of new apartment construction is still being absorbed, which limits how much landlords can raise rents.
What emerges is a market moving in two directions at once. Buyers with stable jobs and cash on hand have more bargaining power than they have had in years, while sellers face longer waits and more pressure to cut prices. Multifamily owners may benefit from households staying in the rental market longer, but that benefit comes paired with expensive financing and uneven rent growth from one city to the next. Whether the shift ultimately favors landlords will depend on local supply, the direction of interest rates, and how long would-be buyers remain on the sidelines. The Federal Reserve’s next rate decision, roughly two weeks away, should offer the next clue.
